GreptimeDB as Prometheus Long-term Storage
Is GreptimeDB suitable as a long-term storage solution for Prometheus? To find an answer to this question, I set up a simple configuration of GreptimeDB (v0.13) to investigate.
What is GreptimeDB?⌗
GreptimeDB is an open-source cloud-native time series database that integrates metrics, logs, and events.
GreptimeDB as Prometheus Long-term Storage⌗
Key features include:
Unified Data Model: It can handle metrics, logs, and events (possibly traces too?) in a single database. GreptimeDB’s data model treats all time series as events with timestamps and context, allowing management under a single model. GreptimeDB supports SQL, enabling queries that can retrieve both metrics and logs in a single query.
Support for Various Collection Protocols: Supports various observability data including Prometheus, InfluxDB, MySQL, OpenTSDB, etc.
Parquet-based Column Storage: Efficient structure for high cardinality data
Computing and Storage Separation Based on Cloud Object Storage: Independent scalability of each resource
Various Indexing Strategies: In Prometheus, all labels are indexed. GreptimeDB allows you to set indexing for specific labels (tags) only. (Both Scanning+Pruning and Indexing can be used)
Architecture⌗
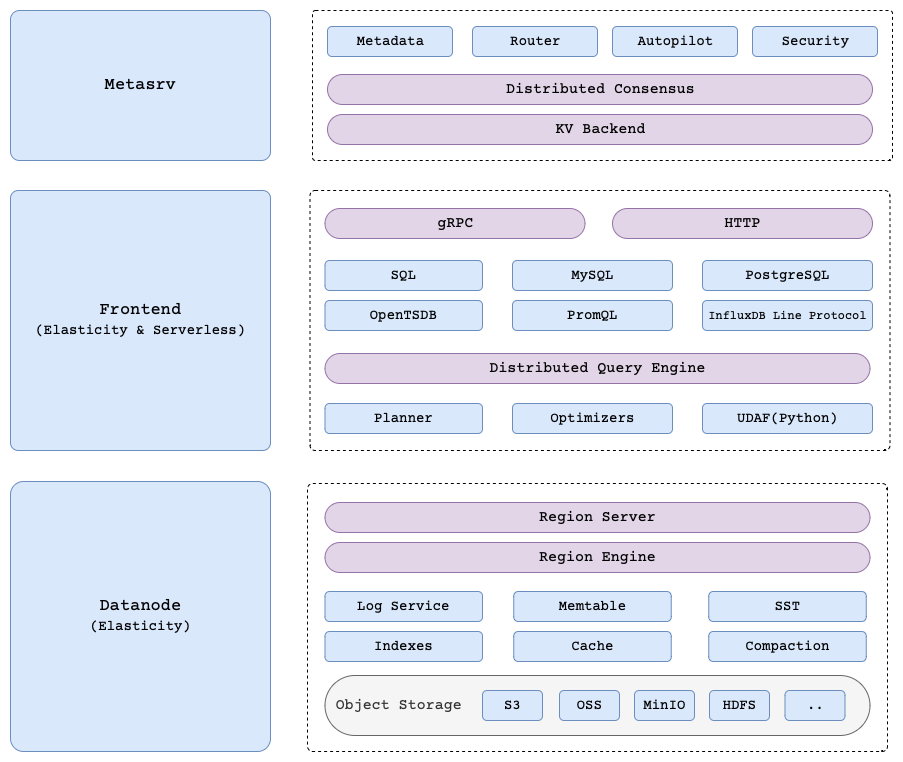
Metasrv:Metasrvmanages database and table information. This includes how data is distributed within the cluster and how collection and query requests are routed. (Requires etcd by default, but also supports pgsql and mysql).Frontend: Supports various collection/query protocols and forwards requests to theDatanodeaccording to the direction ofMetasrvfor collection and queries.Datanode: Manages table regions in the cluster. It receives read and write requests forwarded from theFrontend, processes the data, and returns results.
Cortex or Mimir manages only the ingester information in etcd or consul as a hashring (though they use gossip protocol these days). Compared to this, GreptimeDB’s metasrv manages not only the status of each component but also the table partitioning information, making it contain more metadata and requiring greater stability.
Installation⌗
GreptimeDB supports GreptimeTeam/greptimedb-operator: Run GreptimeDB on Kubernetes. to support operation on Kubernetes.
It also supports GreptimeTeam/helm-charts: Helm charts for deploy GreptimeDB., making configuration easy.
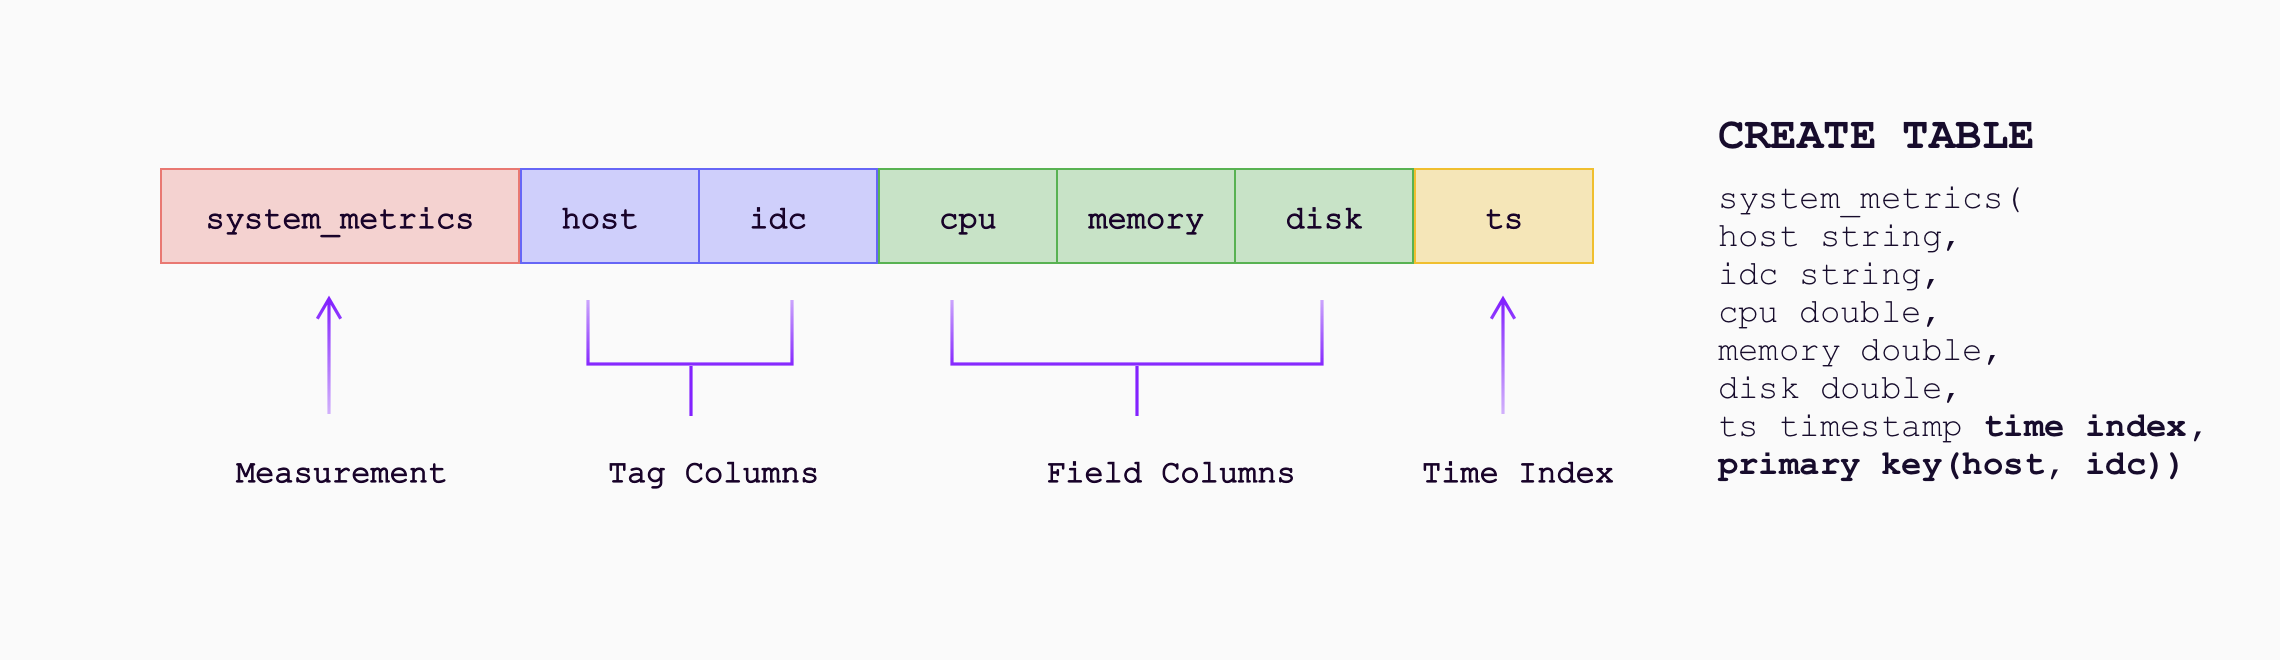
Prometheus and GreptimeDB’s Data Model⌗
GreptimeDB’s data model is composed of Tables with Tags, Fields, and Timestamps. It can be viewed as a multi-value data model similar to InfluxDB’s data model, and it automatically groups multiple Prometheus metrics into (physical) tables.
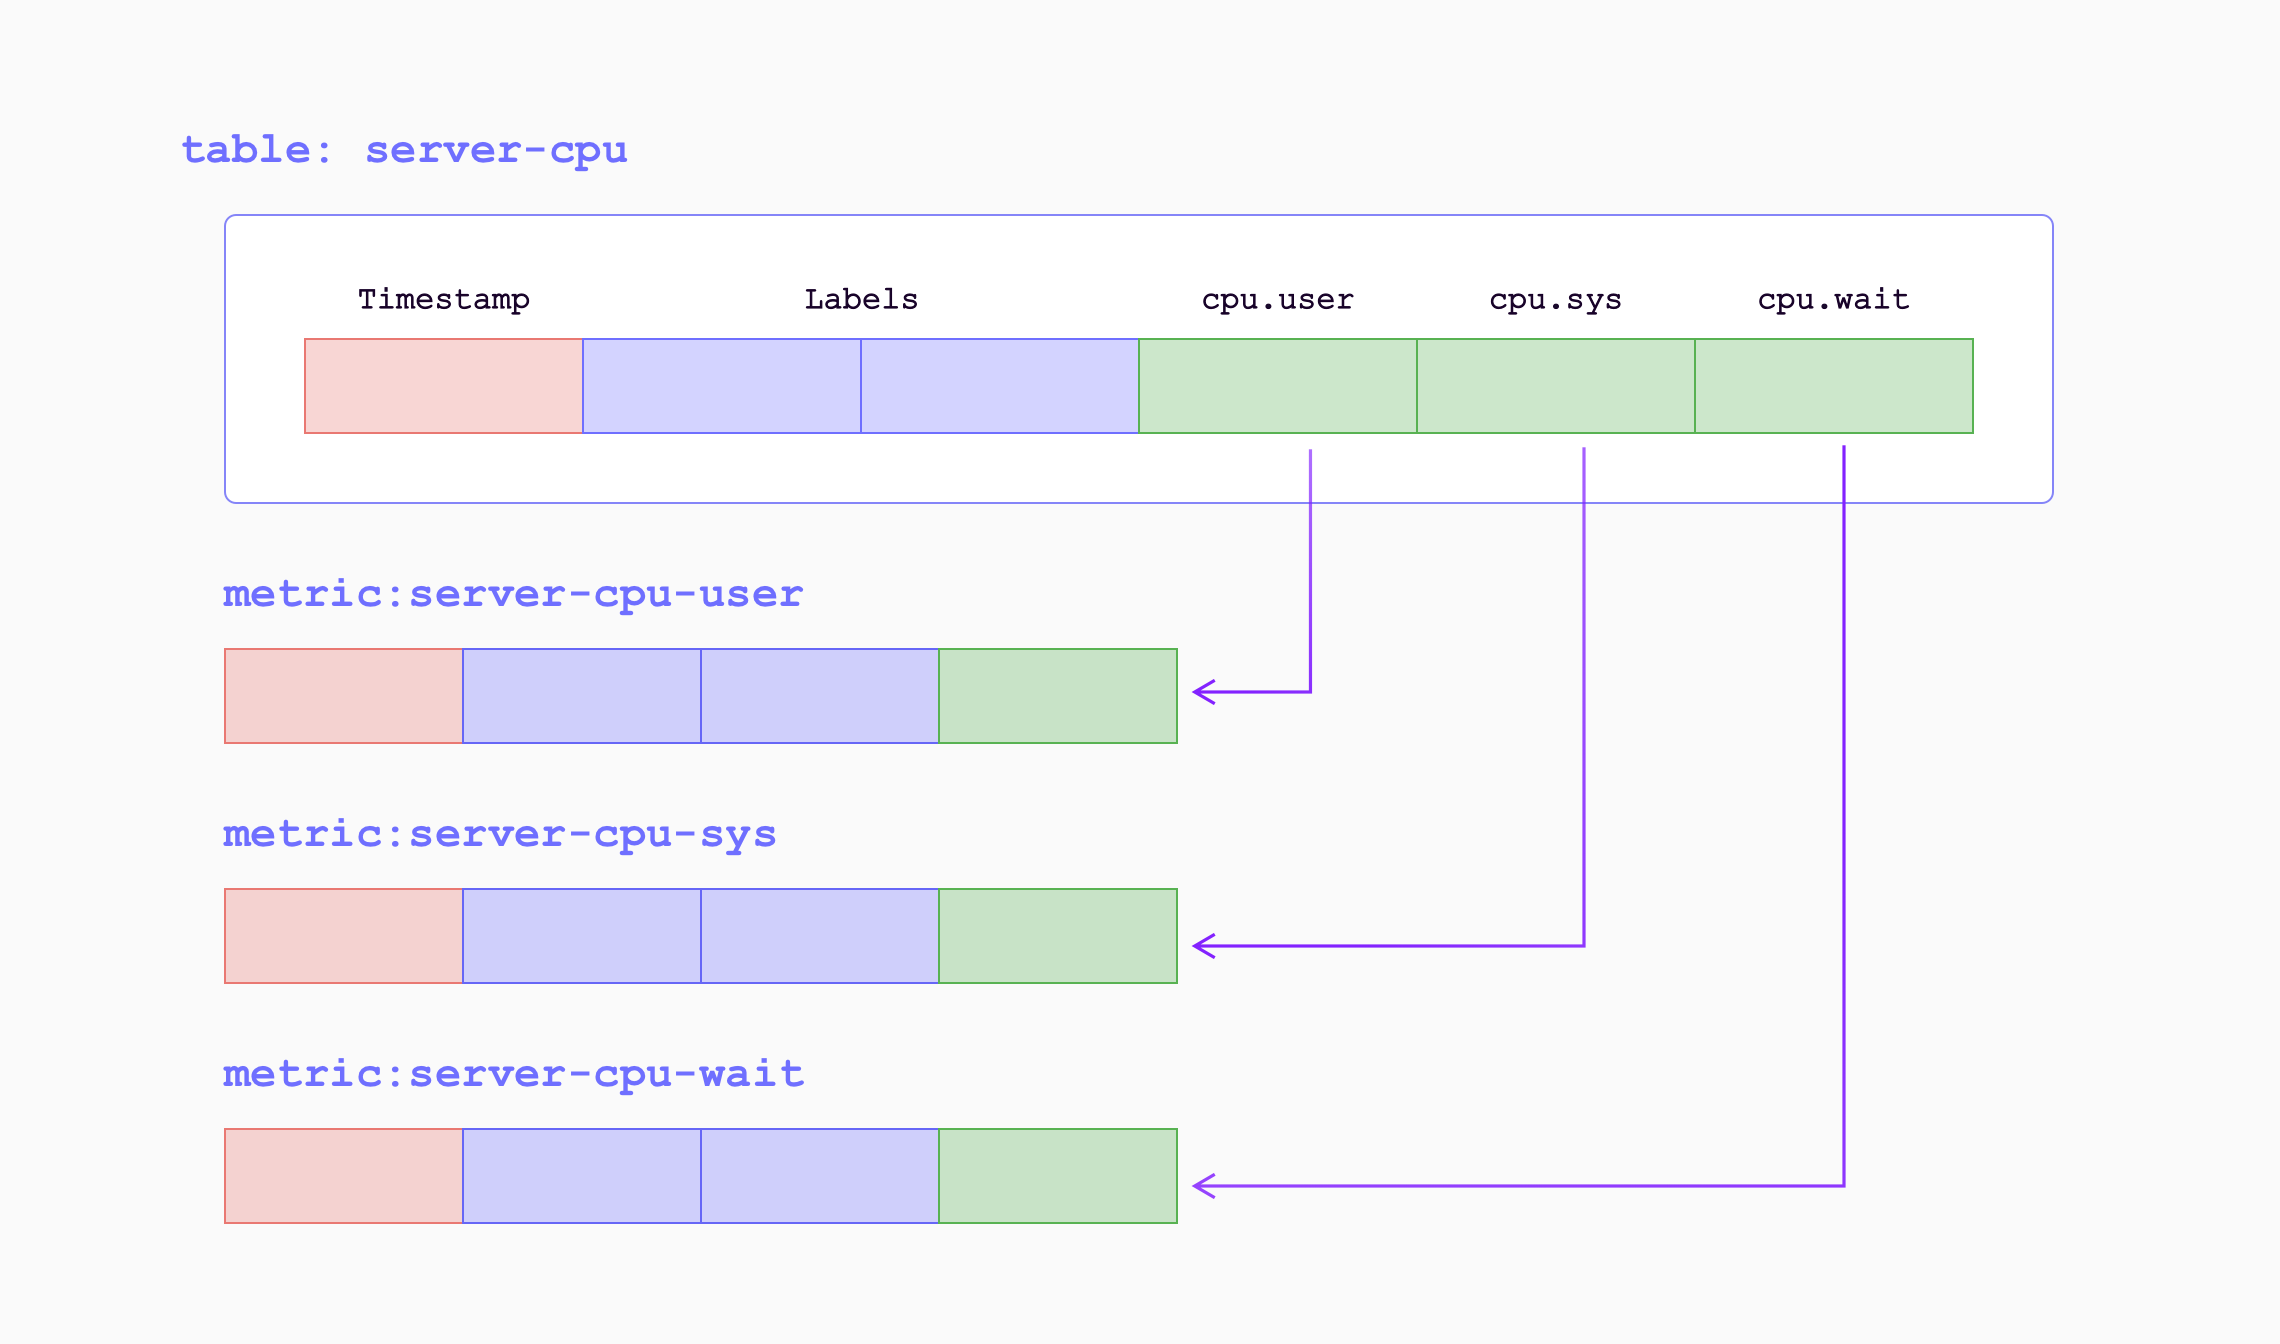
While Prometheus labels are all indexed, GreptimeDB’s data model explicitly distinguishes between tags and fields. Low-cardinality labels can be configured as tags that are indexed (not all tags need to be indexed). High-cardinality data can be configured as fields (while Prometheus is fixed with labels and value, schema configuration in GreptimeDB can be more flexible). And by grouping into tables, storage and query efficiency can be achieved by eliminating duplicate fields.
GreptimeDB’s frontend supports Prometheus remote write and Prometheus HTTP API (which can be used as a Grafana data source).
remote_write:
  - url: http://localhost:4000/v1/prometheus/write?db=public
remote_read:
  - url: http://localhost:4000/v1/prometheus/read?db=public
While Cortex or Thanos separates the ingest component and query component, GreptimeDB’s frontend handles both. Since these two workloads are different, it would be appropriate to divide the frontend into read-only and write-only configurations.
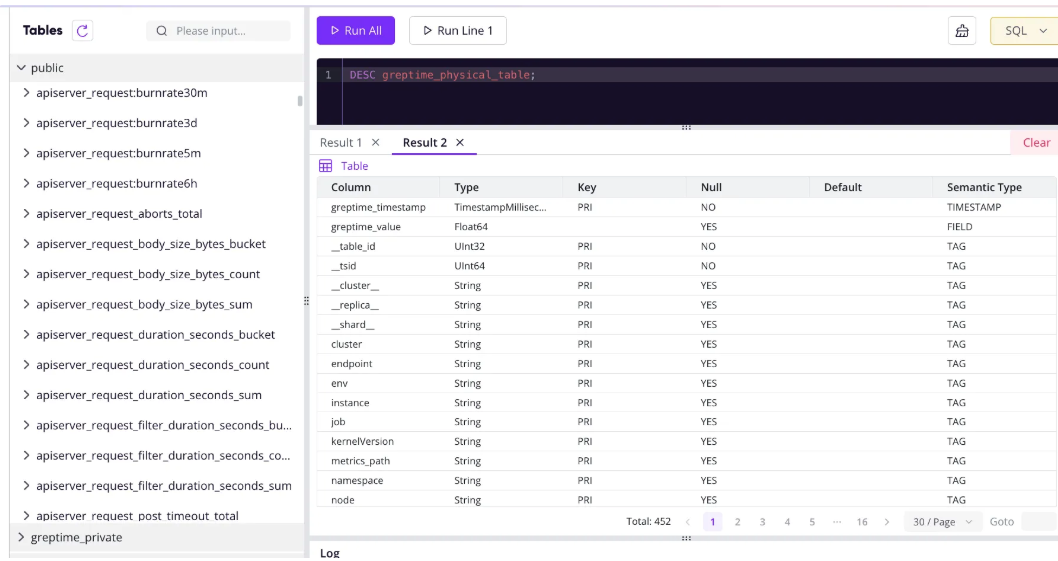
Table Region and Datanode⌗
I have Prometheus configured as a collector for each Kubernetes cluster and forward it to long-term storage via Prometheus remote write (collecting all metrics in Prometheus). In this structure, when forwarding to GreptimeDB as long-term storage, I discovered that metrics weren’t distributed across multiple datanodes but rather routed to a single datanode.
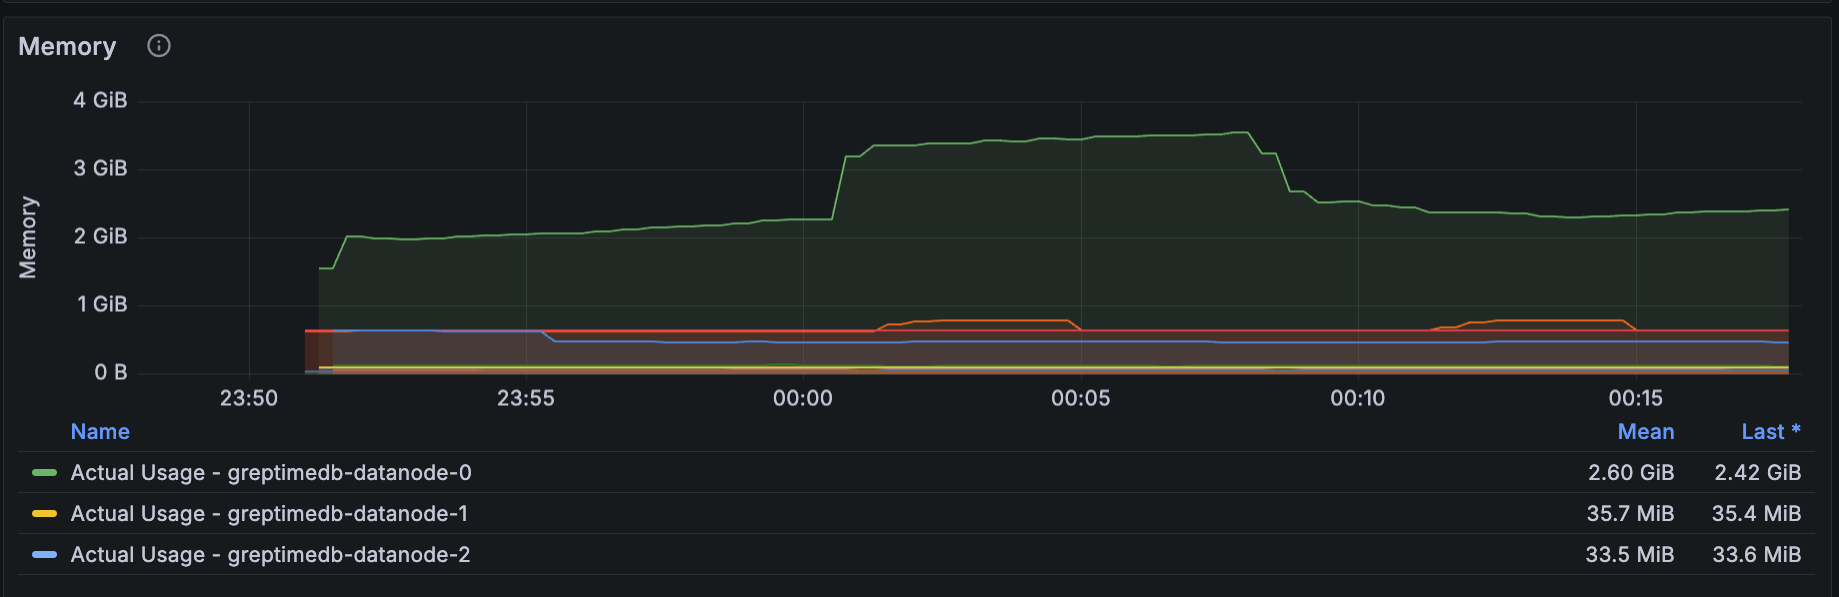
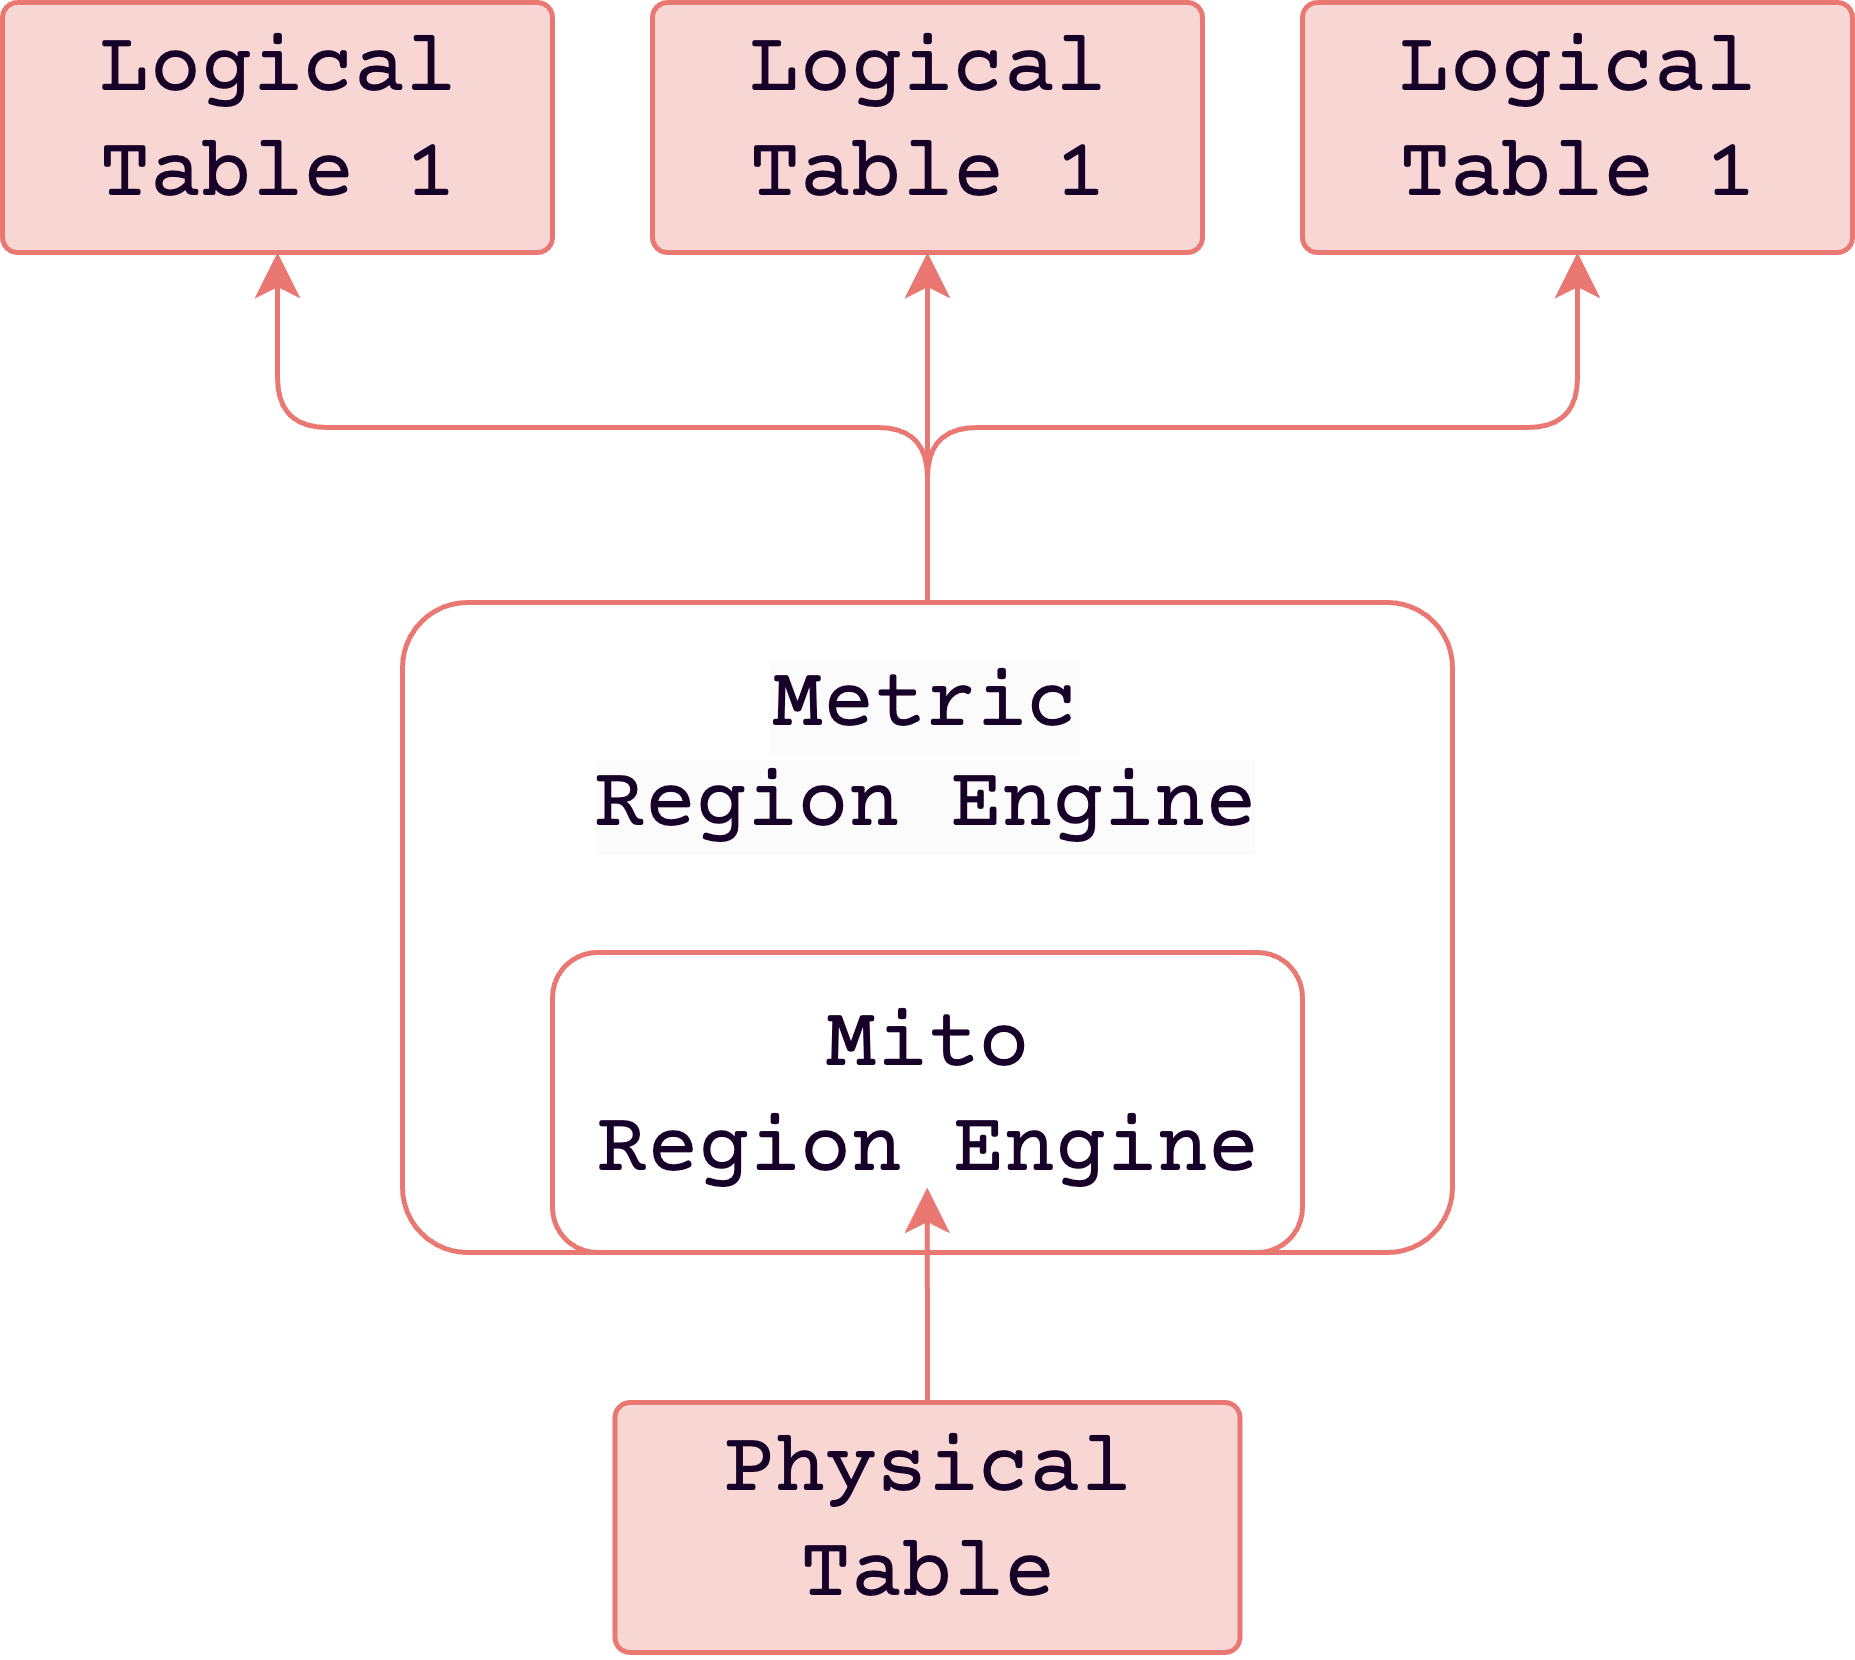
From my experience with Cortex/Thanos, I thought metrics should be distributed across multiple ingesters (datanodes) (but I was wrong). The reason metrics are collected into a single datanode is (to get to the conclusion) there is only one physical table for metrics. Therefore, only one datanode provides all logical regions of that table. So you can find multiple regions in the same datanode. Metric Engine | GreptimeDB Documentation | Unified Time-Series Database
If you want to distribute workload across multiple datanodes, you need to partition the table. However, it seemed there was no approach yet to evenly partition by hashing job labels.
And because metrics are collected into a single datanode, if that node restarts or is in poor condition, it will fail to read all metrics. There should be datanodes (follower peers) that can distribute reads other than the datanode (leader peer) responsible for writes, but this isn’t available yet and is planned to be activated in the enterprise edition. Tracking Issues / Follower regions · Issue #5739 · GreptimeTeam/greptimedb
…
Conclusion⌗
Looking at GreptimeDB so far, I learned several interesting points in the process. To list them somewhat randomly:
- The distinction between write and read layers is necessary.
- The distinction between processing recent data and long-term data is necessary.
- When Prometheus TSDB labels have very high cardinality, storing and searching the inverted index is costly. On the other hand, the scanning+pruning approach commonly used in analytical databases can effectively handle such scenarios, and a hybrid approach might be more effective.