When Kubernetes Nodes Exceed 1000
TL;DR
- When Kubernetes nodes exceed 1000, node exporters deployed as DaemonSets on each node also increase.
- When Prometheus Operator performs Service discovery with Service monitor, it references the service’s endpoints by default.
- Kubernetes Endpoints objects have a default limit of 1000 IPs.
- Only 1000 Prometheus scrape targets are maintained.
- Prometheus should use endpointslices instead of Kubernetes endpoints for Service discovery.
As Kubernetes clusters grow and the number of nodes exceeds 1000, various challenges arise. One particularly important issue from a monitoring perspective is Prometheus Service Discovery.
For node-exporter, cadvisor, kubelet metrics, etc. deployed as DaemonSets on each node, the number of endpoints increases with the node count. For example:
- node-exporter: 1000 nodes = 1000 targets
- kubelet metrics: 1000 nodes = 1000 targets
- cadvisor: 1000 nodes = 1000 targets
The problem lies in the limitations of Kubernetes’ default Endpoints object. A single Endpoints object can only store up to 1000 IP addresses. When nodes exceed 1000, nodes from 1001 onwards are not included in the Endpoints, resulting in Prometheus being unable to scrape them.
# kubectl get endpoints node-exporter -n monitoring -o yaml
apiVersion: v1
kind: Endpoints
metadata:
  name: node-exporter
  namespace: monitoring
subsets:
  - addresses:
      - ip: 10.0.1.1
      - ip: 10.0.1.2
      # ... up to 1000 only
      - ip: 10.0.4.232
    ports:
      - port: 9100
        protocol: TCP
In this situation, if metrics from some nodes are not collected, monitoring blind spots occur and alarms may not work properly.
Endpoints and EndpointSlices⌗
Kubernetes Endpoints objects store IP addresses of Pods connected to Services. However, there are several limitations:
- Size limitation: A single Endpoints object can store a maximum of 1000 IPs
- Performance issues: Large Endpoints objects burden etcd and the API server
- Update inefficiency: The entire Endpoints object is updated even when a single Pod changes
EndpointSlices, introduced from Kubernetes 1.16, were designed to solve these problems:
- Distributed storage: Stored as multiple small objects (100 endpoints per slice by default)
- Efficient updates: Only modified slices are updated
- Scalability: Can scale without node count limitations
# kubectl get endpointslices -n monitoring -l kubernetes.io/service-name=node-exporter
apiVersion: discovery.k8s.io/v1
kind: EndpointSlice
metadata:
  name: node-exporter-abc123
  namespace: monitoring
  labels:
    kubernetes.io/service-name: node-exporter
addressType: IPv4
endpoints:
  - addresses:
      - 10.0.1.1
    conditions:
      ready: true
  - addresses:
      - 10.0.1.2
    conditions:
      ready: true
# ... up to 100
ports:
  - port: 9100
    protocol: TCP
---
apiVersion: discovery.k8s.io/v1
kind: EndpointSlice
metadata:
  name: node-exporter-def456
  namespace: monitoring
  labels:
    kubernetes.io/service-name: node-exporter
# ... next 100
Comparison Table⌗
| Feature | Endpoints | EndpointSlices |
|---|---|---|
| Max IP count | 1000 | Unlimited (distributed across slices) |
| Object size | Large and single | Small and multiple |
| Update efficiency | Low (full update) | High (partial update) |
| API server load | High | Low |
| Introduced in | v1.0 | v1.16 (GA: v1.21) |
Endpoints API Deprecation⌗
Starting from Kubernetes 1.33, the Endpoints API is officially deprecated, and the API server returns warnings to users who read or write Endpoints resources without using EndpointSlices. For more details, see the official Kubernetes blog.
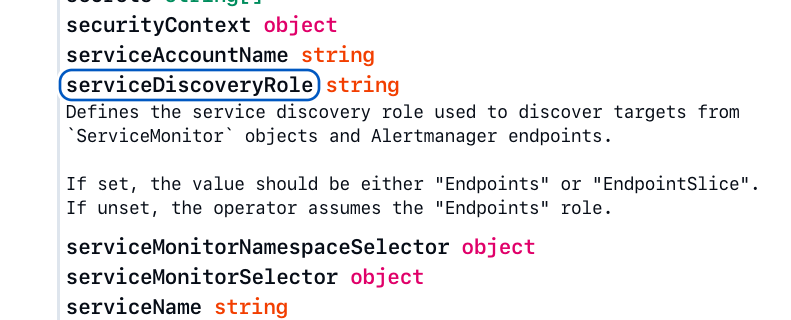
Prometheus Operator’s serviceDiscoveryRole⌗
When using Prometheus Operator, scrape targets are defined through the ServiceMonitor CRD. ServiceMonitor discovers targets by referencing Kubernetes Service Endpoints by default.
Prometheus Operator v0.81.0 Spec: Prometheus
Starting from Prometheus Operator v0.50.0, the serviceDiscoveryRole field was introduced to allow selecting the Service Discovery method:
apiVersion: monitoring.coreos.com/v1
kind: Prometheus
metadata:
  name: kube-prometheus
  namespace: monitoring
spec:
  serviceDiscoveryRole: EndpointSlice # default: Endpoints
  serviceMonitorSelector:
    matchLabels:
      team: platform
Possible values:
Endpoints: Use traditional Endpoints objects (default)EndpointSlice: Use EndpointSlices
Considerations When Changing Settings⌗
- Check Kubernetes version: EndpointSlices are available in k8s 1.16+, GA in 1.21+
- Update RBAC permissions: Need to add permissions for Prometheus to read EndpointSlices
apiVersion: rbac.authorization.k8s.io/v1
kind: ClusterRole
metadata:
  name: prometheus
rules:
  - apiGroups: ["discovery.k8s.io"]
    resources:
      - endpointslices
    verbs: ["get", "list", "watch"]
- Gradual migration: Validate in test environment first before applying to production
Prometheus Operator and Kubelet Endpoints⌗
Kubelet metrics work differently from the typical Service/Endpoints pattern. Kubelet is a system component running on each node that must be accessed directly without a Service object.
Prometheus Operator automatically creates and manages Endpoints objects for collecting kubelet metrics by default:
apiVersion: v1
kind: Endpoints
metadata:
  name: kubelet
  namespace: kube-system
  labels:
    app.kubernetes.io/managed-by: prometheus-operator # Managed by Operator
    app.kubernetes.io/name: kubelet
    k8s-app: kubelet
subsets:
  - addresses:
      - ip: 10.0.1.1 # node1
      - ip: 10.0.1.2 # node2
    # ... can store up to 1000 only
    ports:
      - name: https-metrics
        port: 10250
The app.kubernetes.io/managed-by: prometheus-operator label indicates that these Endpoints are automatically managed by Prometheus Operator.
Issues⌗
When Prometheus’s serviceDiscoveryRole is changed to EndpointSlice, kubelet also uses EndpointSlice. However, Kubernetes EndpointSlice mirroring has a 1000 limit:
- EndpointSlice mirroring controller mirrors (by default) a maximum of 1000 endpoints (reference)
- With more than 1000 nodes, EndpointSlice cannot scrape all kubelets
Solutions⌗
1. Safe Migration Strategy (Recommended)⌗
This is the safe migration method suggested in Prometheus Operator GitHub issue #7678:
Step 1: Configure to manage both objects
# Prometheus Operator Deployment
apiVersion: apps/v1
kind: Deployment
metadata:
  name: prometheus-operator
  namespace: monitoring
spec:
  template:
    spec:
      containers:
        - name: prometheus-operator
          args:
            - --kubelet-endpoints=true # Continue managing Endpoints
            - --kubelet-endpointslice=true # Also manage EndpointSlice
Step 2: Verify EndpointSlice object creation
# Verify that EndpointSlice was created successfully
kubectl get endpointslices -n kube-system -l kubernetes.io/service-name=kubelet

# Check created EndpointSlice
kubectl get endpointslice kubelet-8jkql -n kube-system -o yaml
The created EndpointSlice includes the following labels:
metadata:
  labels:
    app.kubernetes.io/managed-by: prometheus-operator
    endpointslice.kubernetes.io/managed-by: prometheus-operator # Directly managed by Operator
    kubernetes.io/service-name: kubelet
Step 3: Configure Prometheus to use EndpointSlice
apiVersion: monitoring.coreos.com/v1
kind: Prometheus
metadata:
  name: kube-prometheus
spec:
  serviceDiscoveryRole: EndpointSlice # Use EndpointSlice
Step 4: Disable Endpoints after confirming normal operation
# Disable Endpoints management when everything works normally
args:
  - --kubelet-endpoints=false # Stop creating Endpoints
  - --kubelet-endpointslice=true # Manage only EndpointSlice
2. Preventing EndpointSlice Mirroring⌗
Endpoints managed by Prometheus Operator have special labels added:
apiVersion: v1
kind: Endpoints
metadata:
  labels:
    app.kubernetes.io/managed-by: prometheus-operator
    endpointslice.kubernetes.io/skip-mirror: "true" # Prevent mirroring
The endpointslice.kubernetes.io/skip-mirror: "true" label prevents Kubernetes’s EndpointSlice mirroring controller from automatically mirroring these Endpoints to EndpointSlice. This is because Prometheus Operator directly manages the EndpointSlice.
3. Before and After Migration Comparison⌗
Before migration (managed by Mirroring Controller):
kind: EndpointSlice
metadata:
  labels:
    endpointslice.kubernetes.io/managed-by: endpointslicemirroring-controller.k8s.io
After migration (directly managed by Prometheus Operator):
kind: EndpointSlice
metadata:
  labels:
    app.kubernetes.io/managed-by: prometheus-operator
    endpointslice.kubernetes.io/managed-by: prometheus-operator # Directly managed by Operator
Conclusion⌗
When Kubernetes clusters grow beyond 1000 nodes, monitoring systems must be designed to scale accordingly. By utilizing EndpointSlices, stable metric collection is possible without node count limitations. Migration can be easily accomplished through Prometheus Operator’s serviceDiscoveryRole setting, and for kubelet metrics, the transition can be made using both --kubelet-endpoints and --kubelet-endpointslice flags together.